Financial dashboard for small business owners is not just a nice-to-have, it is a must. Running a business without knowing your numbers is like driving blind. A dashboard gives you a real-time snapshot of revenue, expenses, profit, cash flow, and more so you can make confident decisions without drowning in spreadsheets. In this guide, you will learn how to build one from scratch even if you are not a finance expert.
What Is a Financial Dashboard for Small Business?
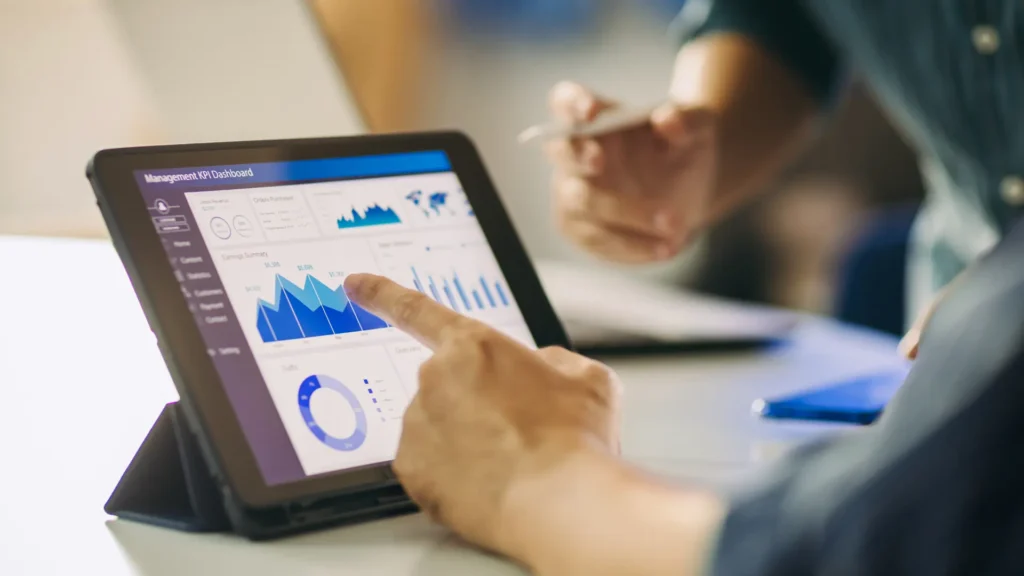
A financial dashboard is a visual tool that tracks your small business’s most important metrics in one place. It gives you a high-level view of how your business is performing—updated in real-time.
Instead of hunting for reports or relying on your gut, you can use your dashboard to see where money is coming from, where it’s going, and what you need to do next.
What to Include: Key Financial Metrics That Matter
Before you build, you need to decide what to track. These financial KPIs (Key Performance Indicators) are a solid starting point for most small businesses:
Revenue (monthly, quarterly, or trailing 12-month)
Your total income before expenses. Track it monthly to see trends. Use trailing 12-month (TTM) to smooth out seasonal spikes.
Expenses (total and by category)
All outgoing costs—rent, payroll, supplies, subscriptions. Break it down by category so you can spot overspending.
Profit margin
The percentage of revenue left after expenses. It’s a key measure of pricing, cost control, and sustainability.
Cash flow
The movement of money in and out. Positive cash flow keeps your business running—even if profit looks good on paper.

Accounts receivable and payable
What clients owe you (receivables) and what you owe vendors (payables). Monitoring both protects your working capital.
Working capital
Current assets minus current liabilities. This shows your ability to handle short-term obligations without stress.
EBITDA
Earnings Before Interest, Taxes, Depreciation, and Amortization. Useful for growth-stage businesses or investor reporting.
Key financial ratios
- Current ratio = Can you pay your short-term bills with what you have on hand?
- Debt-to-equity ratio = How much of your business is funded by debt vs. your own investment?
Tracking these helps you stay in control and spot issues early.
Choosing the Right Financial Dashboard Tool for Small Business
You do not need anything fancy to get started. Here are a few financial dashboard for small business options:
- QuickBooks Online or Xero – Great built-in dashboards
- Google Sheets or Excel – Customizable and free
- Google Looker Studio – Pulls from Google Sheets, Analytics, etc.
- Power BI or Tableau – Best for high-volume or team dashboards
Choose a tool you’ll actually check. Automation is key.
Design Tips: Keep It Clear and Clean
Your financial dashboard should be clear enough to scan in under a minute. Keep these points in mind:
- Group data by category: Revenue, Expenses, Profitability, Liquidity
- Use charts to highlight trends, not just raw numbers
- Keep colors and fonts consistent
- Avoid clutter—less is more
- Interactive filters like date ranges or department tags make dashboards more useful without adding complexity

Automate Your Data Feed
Manual entry can kill momentum. Use built-in integrations or Zapier to connect your accounting software, CRM, and spreadsheets to your financial dashboard for small business.
Most platforms support automatic updates from:
- QuickBooks or Xero
- Stripe, PayPal, or Square
- Google Sheets
- Your bank feeds
Set it once. Let it update itself.
Use Your Dashboard to Make Decisions
A financial dashboard for small business is not just a report, it is a decision-making tool. You can use it to:
- Spot profit leaks
- Track cash runway
- Adjust pricing or expenses
- Plan hiring
- Justify funding
- Avoid panic during tax time
It’s also a helpful tool to review with your accountant or advisory team.
Start Simple, Then Build
You do not need to track everything on day one. Start with 5 to 7 core metrics and build from there. The goal is visibility, not perfection. As you use it, your financial dashboard for small business will grow and adapt with your needs.
Feeling stuck in the numbers?
Whether your books are messy, late, or nonexistent, we can help you catch up and move forward — without judgment, jargon, or surprise fees.
👉 Schedule a call
👉 Learn more – https://accuracyaccounting.uscash-flow-profitability-audits/